

This braces calculator gives you a cost range for your own case, not a single national guess. Pick your state, your brace type, and how complex your case is, and it returns a range built from published study data. It is free and takes seconds. The calculator sits right below.
Your estimate
Estimate only, based on published cost-study data (see how we calculate, below). Your orthodontist's quote depends on your case. This is not medical or financial advice.
How This Estimate Works
Pick your state and brace type
Choose where you live and whether you want metal, ceramic, or lingual braces. You also set how complex your case is: mild, moderate, or complex.
See your range
The tool returns a cost range built from published study data for that state and type. It is a real starting point, not a flat national average.
Compare and choose your next step
Measure your range against any quote you have. Then read your state page or the insurance guide to plan what you will actually pay.
National Snapshot
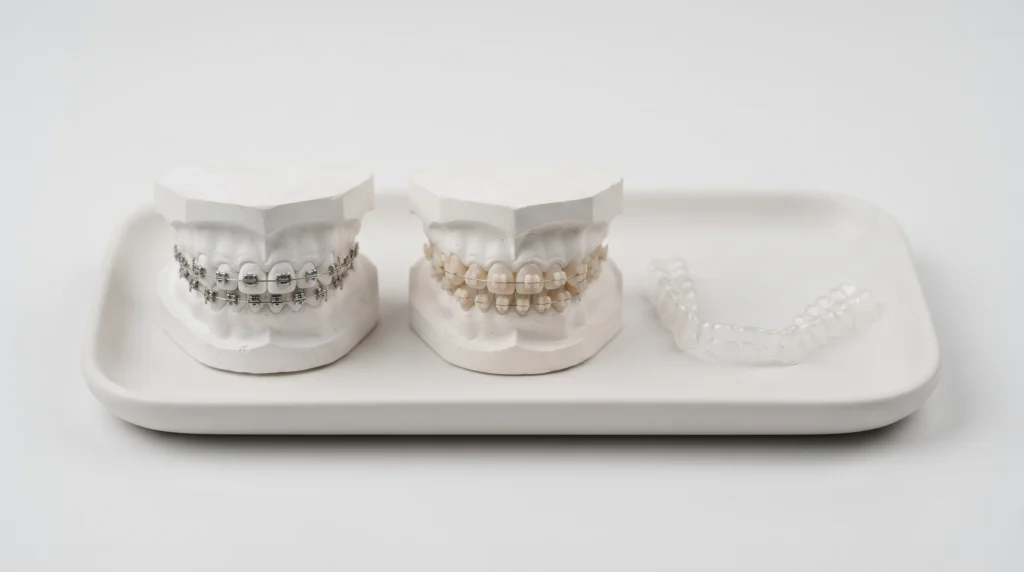
Before you run your own number, here is the national picture. These are the average prices and published ranges for each brace type across the country. The calculator starts from figures like these, then adjusts them for your state and your case.
Brace type | Published range | National average |
Traditional metal braces | $2,500 to $10,000 | $6,343 |
Ceramic (clear, tooth colored) braces | $4,480 to $11,312 | $5,834 |
Lingual braces (behind the teeth) | $7,321 to $17,411 | $9,221 |
Clear aligners | $1,800 to $8,100 | $5,108 |
The clear aligner low end of $1,800 reflects limited and direct to consumer cases, not a full treatment plan. Most full aligner cases cost far more.
Source: Synchrony CareCredit Average Procedural Cost Study, ASQ360° research, 2023 to 2024, published at carecredit.com. Prices last checked: October 2026.
How the Braces Calculator Works
The braces calculator does not guess. It starts from a dataset built state by state and type by type from the Synchrony CareCredit study. It adjusts the national figure by your state’s published cost level, then uses your case complexity to place you inside the range. Here is each step.
It starts from published study data. The dataset comes from the Synchrony CareCredit Average Procedural Cost Study, which publishes figures for every state and brace type. That is the foundation under every estimate, so the numbers trace to a named source, not a house opinion.
It adjusts for your state. Each state figure adjusts the national figure by that state’s published cost level. This is why the same brace type returns a different range in different states, rather than one flat national number.
It places you by case complexity. A mild case sits lower in the range and a complex case sits higher, because complexity moves a real quote more than anything else. The tool reflects that spread instead of handing you a single figure.
Insurance is not in the headline number. The estimate is the treatment cost before any coverage. Insurance is a separate step, supported by FAIR Health data, and we cover it in full in how insurance changes your estimate.
The figures are kept current. We recheck the numbers whenever the study updates. The American Association of Orthodontists publishes no national fee, and states that cost varies by appliance, case complexity, and treatment length, and that most member orthodontists offer a free or low cost first consultation. For the full national picture, see the complete guide to braces costs.
Frequently Asked Questions
Ready to see your own range? It takes three choices and a few seconds. You can also compare prices in all 50 states.
This tool gives estimates built from published averages. They are a guide, not a quote. Your real price comes from a consultation with an orthodontist who can see your teeth. This page is not dental or financial advice.